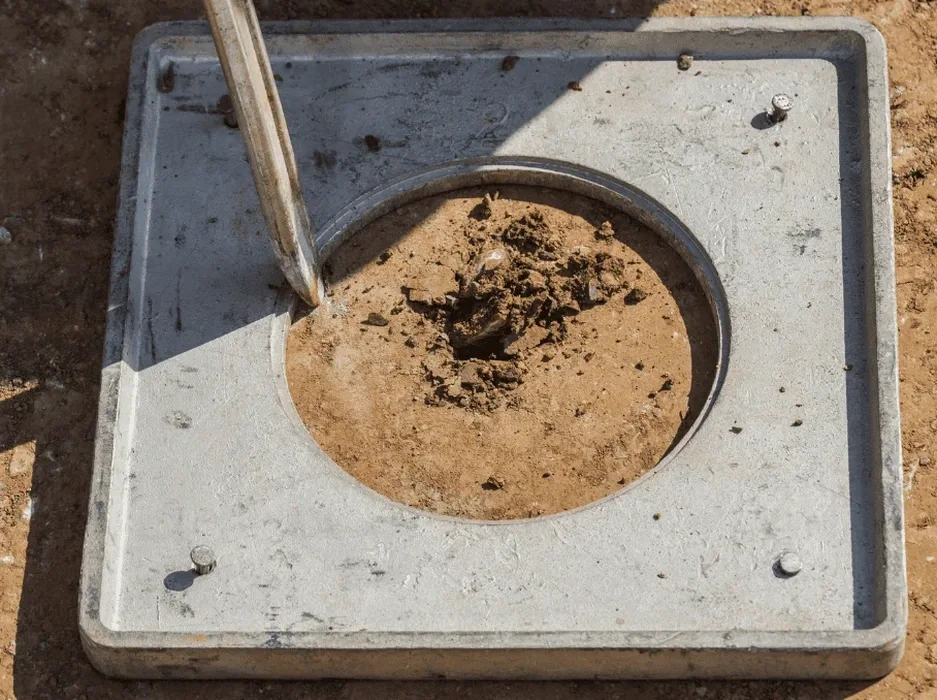
The cone penetration test rig is the first thing we mobilise for a liquefaction screening in the Naas area. A 20-tonne truck with a stabiliser footprint spreads the load on the glacial till that underlies much of the town, pushing an electronic cone at a constant 20 mm/s while pore pressure transducers record the response. Naas sits on the eastern edge of the Irish Midlands, where the River Liffey tributaries have deposited layers of loose silty sand that can densify under cyclic loading. The raw data — tip resistance, sleeve friction, and dynamic pore pressure — feeds directly into the cyclic stress ratio calculation. Without that profile, you are guessing about the factor of safety against flow failure. When the CPT test log shows a thin sand lens at 4 metres with a normalised cone resistance below 70, we flag it immediately for further cyclic laboratory work.
A sand layer with less than 15% fines and a cone resistance below 7 MPa at 4 metres depth in Naas is a textbook liquefiable deposit — and it only takes one unrecognised seam to compromise a foundation.
Service characteristics in Naas
Risks and considerations in Naas
Eurocode 8 Part 1 (EN 1998-1:2004) and the Irish National Annex require a liquefaction assessment for sites in ground type D or E when the reference peak ground acceleration exceeds 0.05g. The Geological Survey of Ireland maps show that significant portions of Naas are underlain by alluvial and glaciofluvial deposits that fall squarely into those categories. The risk is not theoretical — loose saturated sands that look competent during a dry summer investigation can behave completely differently when groundwater rises in winter and a distant earthquake sends a train of shear waves through the deposit. The most dangerous scenario we encounter is a crust of desiccated clay over a trapped sand layer; the crust masks the problem during a visual inspection, but the cyclic mobility potential remains. A proper liquefaction analysis for Naas must account for seasonal water table fluctuation and use site-specific ground motion data, not generic hazard maps.
Our services
A liquefaction assessment in Naas rarely stops at the field data. We run a structured workflow that moves from screening-level evaluation to advanced laboratory testing when the stratigraphy demands it. The three core service blocks below cover the typical project path from site investigation through to engineering recommendation.
CPT-Based Liquefaction Screening
We deploy a 20-tonne CPT rig with pore pressure measurement across Naas sites, logging cone resistance and sleeve friction at 20 mm/s. The data is processed using the Robertson (2009) method to calculate the soil behaviour type index and the cyclic resistance ratio for each sand layer encountered. A screening report with factor of safety profiles is issued within five working days.
Cyclic Triaxial Testing
When the screening flags a marginal factor of safety, we recover undisturbed samples using a piston sampler and subject them to cyclic triaxial loading in our accredited laboratory. The test replicates the stress path during an earthquake, measuring the number of cycles to liquefaction at different CSR levels. Results feed directly into the Boulanger & Idriss semi-empirical procedure.
Ground Improvement Verification
For Naas projects where vibrocompaction or stone columns are specified to mitigate liquefaction, we perform pre- and post-treatment CPT comparisons to quantify the improvement in cone resistance and confirm that the target factor of safety has been achieved across the treated footprint.
Quick answers
How much does a soil liquefaction analysis cost for a site in Naas?
The cost typically ranges from €2,570 to €3,730, depending on the number of CPT locations, the depth of investigation, and whether cyclic triaxial testing is required. A screening-level assessment with two CPT soundings to 15 metres falls at the lower end, while a full analysis with undisturbed sampling and laboratory testing moves toward the upper end.
Is liquefaction really a risk in Ireland, given the low seismicity?
Ireland is a low-to-moderate seismicity region, but the hazard is not zero. The Irish National Annex to Eurocode 8 assigns a reference PGA of 0.04g to 0.08g for much of the country, and the soft alluvial deposits found in Naas can amplify ground motion significantly. A loose saturated sand with low fines content can liquefy at PGA values as low as 0.05g, so assessment is prudent for critical structures.
What depth do you investigate for liquefaction assessment in Naas?
We typically investigate to a depth of 15 to 20 metres below ground level. Liquefaction in Naas is most commonly observed in sand layers between 2 and 10 metres depth within the alluvial and glaciofluvial deposits. Deeper investigations may be warranted if the geological model indicates the presence of buried channels or deeper granular units.
Which method do you use to calculate the factor of safety against liquefaction?
We apply the Boulanger & Idriss (2014) semi-empirical procedure, which correlates normalised cone resistance and fines content to the cyclic resistance ratio. The cyclic stress ratio is computed using the site-specific peak ground acceleration from the Irish National Annex and a depth-dependent stress reduction factor. Both Robertson (2009) and Boulanger & Idriss methods are cross-checked for consistency.
How long does a liquefaction analysis take from start to finish?
A typical programme runs two to three weeks. The field investigation with CPT takes one or two days on site in Naas. Data processing and the screening report are completed within one week. If undisturbed sampling and cyclic triaxial testing are required, the laboratory phase adds another 10 to 14 working days due to the consolidation and cyclic loading stages.